Who food assistance reaches in Hawai‘i — and what moves the numbers.
Thirty-seven years of SNAP participation, benefits, and the shocks behind every turn in the line. Each section leads with what the data means, not just what it shows.
Live data · USDA FNS & Hawai‘i DHSLoading…
Loading data...
Overview
One in nine residents relies on SNAP — and the rolls never returned to where they started.
Headline measures for the most recent reporting month. The 37-year story behind them is the next section.
--
Persons Participating
--
--
Households Served
--
--
Avg Benefit/Household
--
--
Monthly Program Cost
--
1 in 9 residents is on SNAP —
as many people as live in all of Maui County. The caseload isn’t an abstraction; it’s an entire island-county of people.
Maui County — the population the SNAP caseload equals
rest of Hawai‘i
—
A slice of the islands
On one axis, Hawai‘i's whole resident population towers over the SNAP caseload below it — at any moment only about 1 in 9 residents receives benefits. The dashed amber band is how many residents were eligible, implied by USDA's annual participation-rate estimates: the daylight between it and the green area is people who qualify but aren't enrolled. In FY2022, Hawai‘i reached 81% of eligible residents — significantly below the national 88% — leaving roughly 1 in 5 eligible people unenrolled. (Estimates are model-based with wide uncertainty for a small state; gaps in the band are years USDA published no estimate.)
Key findings
Hawaii's SNAP program has served an average of -- people per month over the past two decades
Peak participation occurred in -- with -- individuals
The COVID-19 pandemic drove participation to historic highs, with significant increases in both enrollment and benefit levels
As of --, the program was serving -- individuals across -- households
Trends
Thirty-seven years in six acts — every shock left a higher floor.
One continuous line, 1989 to today (USDA federal, then Hawai‘i DHS). Scroll to walk it: a stable floor, then each crisis resetting participation upward and rarely falling back.
Persons receiving SNAP each month · 1989–2026
—
persons this view
—
period
Act 1 · 1989–2008
A stable floor
For two decades, participation held in a steady band — roughly 100,000–120,000 people in any given month. The one sharp exception: September 1992, when Hurricane Iniki devastated Kaua‘i and disaster SNAP briefly pushed enrollment up about 30%.
Act 2 · 2008–2013
The Great Recession
The downturn pushed the line past 190,000 and held it there. It never fell back to its old floor — the first reset to a higher baseline.
Act 3 · 2020–2021
COVID-19 & emergency allotments
Tourism's collapse drove enrollment to an all-time peak — about 206,000 in July 2021 — while federal emergency allotments roughly doubled benefits.
Act 4 · 2023
The Maui wildfires
The Lahaina fire on August 8, 2023 drove a sharp, localized surge: Maui County enrollment climbed +25% in four months — nearly twice the statewide rate — peaking that November. Only the monthly DHS island data catches it.
Act 5 · 2025–2026
The federal shutdown
The first disruption the data caught in real time: participation peaked in October 2025, then fell every month — about −7% by May 2026 — as the shutdown, a 2% benefit cut, and new work requirements compounded.
Act 6 · Today
A new, higher baseline
Step back and the staircase is the story: each shock settled into a floor higher than the last. Today's caseload sits roughly 9% above its 2019 level — the 2025 shutdown and new work requirements have pulled it back toward the old floor.
Recipients
Households and individuals move together — and both sit well above their pre-pandemic floor.
Persons and households participating in SNAP
Monthly persons and households across the full series (1989–2026). The two move together — roughly two people per household — and both reset to a higher floor after each economic shock. (Share of residents on SNAP now rides the right axis of “A slice of the islands” in the Overview.)
Implications
Economic Indicator
SNAP participation serves as a real-time indicator of economic hardship. Sharp increases often precede or coincide with economic downturns, making this data valuable for policy planning.
Long-term Stability
The data shows a baseline of 50,000-60,000 households needing food assistance even during economic growth periods, indicating persistent food insecurity challenges in Hawaii.
Growth Trajectory
Year-over-year analysis reveals -- change in participation, reflecting current economic conditions and policy changes.
Getting on: application processing
SNAP Application Processing Timeliness
Monthly applications received and the % processed on time (within 30 days, or 7 for expedited), FFY 2009–present, backfilled from DHS archives. Note the application spike and the dip in on-time processing during the post-pandemic period. Gaps reflect source files DHS published only as images or partial-year summaries.
Benefits
Benefits spiked with pandemic aid, then fell three years running — into rising food prices.
What a benefit actually buys: about $4 a meal
breakfast
lunch
dinner
$4
per person, per meal
Total monthly benefits ÷ people ÷ ~30 days ÷ 3 meals — among the highest per-meal benefits in the nation, because Hawai‘i’s allotments adjust for island food costs.
Average Monthly Benefit Per Household
Evolution of average benefit levels adjusted for program changes and cost of living.
Total Monthly Program Costs
Total federal expenditure on SNAP benefits in Hawaii by month.
Implications
Hawaii's Higher Costs
Average benefits in Hawaii significantly exceed national averages due to the state's high cost of living. This reflects both higher food costs and adjusted federal allotment levels for the islands.
Policy Impact
Notable spikes in benefit levels (particularly in 2021) correlate with emergency COVID-19 allotments and expanded eligibility, demonstrating the program's responsiveness to crisis.
Purchasing Power
The dramatic increase in average benefits during the pandemic period (reaching $733-$988/household) represents a major boost to household food budgets, with significant multiplier effects on Hawaii's economy.
Budget Implications
Peak monthly costs exceeded $111 million in August 2021, highlighting the substantial federal investment in Hawaii's food security and the potential fiscal impact of benefit changes.
Shocks in depth
The shocks, up close.
The arc above hits each shock as an act; here is the detail behind them — pandemic recovery, the 2025 shutdown’s real toll, and the policy changes still in motion.
COVID-19 in depth
Pre-COVID Average
--
households/month
Peak Pandemic
--
households (--)
Increase
--
households added
Pandemic Period Analysis (2019-2025)
Participation and benefit levels before, during, and after pandemic emergency measures.
Implications
Rapid Response Success
The --% increase in participation demonstrates the program's ability to rapidly expand during economic crisis, serving as a crucial safety net for Hawaii's tourism-dependent economy.
Tourism Sector Impact
Hawaii's spike was particularly pronounced due to the near-total shutdown of tourism in March-April 2020, affecting service workers who typically live paycheck-to-paycheck.
Emergency Allotments
The unprecedented benefit levels in 2021 (averaging $700-900/household) reflect federal emergency allotments that temporarily maximized benefits for all recipients.
Recovery Patterns
The decline from peak in late 2021 shows economic recovery as tourism returned, though participation remains elevated above pre-pandemic levels, suggesting lasting economic impacts.
New Baseline Established
As of May 2025, participation has stabilized at approximately 13% above pre-pandemic levels, indicating the pandemic created a new normal with higher structural food insecurity.
Benefit Cliff Impact
Post-emergency benefit levels declined 11.1% from peak but remain 43% above 2019, showing lasting federal commitment even after emergency allotments ended in 2023.
Post-Pandemic Recovery Analysis (2019-2025)
Peak: July 2021 - 206,226 persons (111,900 households)
Current: May 2025 - 163,576 persons (84,333 households)
Decline from Peak: -20.7% in persons, -24.6% in households
New Baseline: Stabilized ~13% above pre-pandemic (Feb 2020) levels
Peak Emergency (Jan 2021-Dec 2021): Maximum participation with emergency allotments
Recovery & Stabilization (2022-2025): Gradual decline settling at new elevated baseline
Complete Recovery Data: Data now includes the complete pandemic recovery period through May 2025, revealing benefit reduction impacts and participation stabilization following emergency measure wind-down. Full analysis available in ANALYSIS_SUMMARY_2025.md.
2025 Federal Shutdown — what actually happened
The chart above already shows it: participation peaked in October 2025, then fell 6.9% through May 2026 as the shutdown, a 2% benefit cut, and new work requirements compounded — the first disruption the data caught in real time. The detailed planning analysis below was written as the shutdown loomed in October 2025.
165,000
People on SNAP
85,000 households
31,000
Federal Employee Households
24K civilian + 44K military
$110M
State Relief Program
~2 month cushion
30%
Food Insecurity Rate
1 in 3 households (2023)
Recent SNAP Policy Changes Adding to Pressure
October 2025: Benefit Reduction
2% benefit cut effective October 1, 2025
$36/month reduction for family of four
$1M monthly impact statewide
Compounds existing benefit adequacy concerns in high-cost Hawaii
November 2025: OBBBA Work Requirements
Potentially 16,000 individuals could lose benefits
The store network barely grew — but local-food sales through it grew eightfold.
Analysis of authorized SNAP retailers in Hawaii from 2004-2024, showing network evolution and food access patterns.
2,641
Total Retailer Records
2004-2024
94.8%
Valid Hawaii Coordinates
2,503 locations
+6
Net Change (2020-2024)
370 new, 364 closed
19
New Farmers' Markets
5.1% of new authorizations
Where SNAP can be spent — and what kind of store
All 867 currently-authorized SNAP retailers with valid coordinates. Most of the network sits on O‘ahu; islandwide, convenience stores rival full grocery stores in number while farmers' markets and produce stands are a thin slice.
Authorized retailers by store type
Currently-active SNAP retailers (2025). Grocery and convenience stores dominate the network; fresh-focused options — farmers' markets, produce stands — are scarce.
Retailer Network Evolution (2020-2024)
High Turnover, Stable Size
Despite 370 new authorizations and 364 closures, the network remained essentially flat (+6 retailers, 0.7% growth). This indicates a mature, stable retailer network with natural business turnover.
Convenience Store Dominance
48.6% of new authorizations were convenience stores (180 stores), reflecting Hawaii's dispersed geography and need for neighborhood food access. Only 31 new supermarkets were authorized.
Geographic Distribution
Retailers mirror population: Honolulu 56.2%, Hawaii County 19.7%, Maui 15.4%, Kauai 8.6%. Rural areas rely more heavily on convenience stores for SNAP access.
Local Food Systems Growth
Farmers' markets and direct-to-consumer options grew from 19 new authorizations, supporting local agriculture and fresher food options for SNAP recipients.
Food Hubs SNAP & Double Bucks Sales Growth
Growth in SNAP benefits and Double Bucks incentive program sales through Hawaii's food hub network (2021-2024).
Food Hubs & Local Food Access
Rapid Growth in Local Food Access
Food hub SNAP sales grew from $136,000 in 2021 to $1.1 million in 2024, representing an 8.2x increase in just three years. This demonstrates growing demand for locally-sourced food among SNAP recipients.
Double Bucks Impact
The Double Bucks incentive program contributed $479,000 in 2024, effectively increasing SNAP purchasing power by 43% at food hubs. This shows the multiplier effect of incentive programs on local food access.
Total Economic Impact
Combined SNAP and Double Bucks sales reached $1.6 million in 2024, supporting local farmers and providing fresh, healthy food options to SNAP households. Food hubs serve as crucial bridges between local agriculture and food assistance programs.
Scaling Opportunity
While food hub sales grew rapidly, they still represent a small fraction of Hawaii's $720M+ annual SNAP spending. Expanding food hub infrastructure and Double Bucks funding could significantly increase local food access and support Hawaii's farmers.
Data Source: Fardkhales, Lincoln, and Heaivilin (forthcoming). Food hub sales data includes SNAP EBT transactions and Double Bucks incentive matching funds across Hawaii's food hub network.
Policy Implications
Food Desert Monitoring: High closure rates require ongoing monitoring to prevent food deserts, especially in rural areas dependent on single stores
Healthy Food Access: Convenience store dominance raises questions about access to fresh, healthy options vs. processed foods
Local Food Support: Growing farmers' market participation (5.1% of new authorizations) suggests opportunity to expand farm-to-SNAP programs
Data Quality: 5.2% of records with invalid coordinates (138 retailers) indicate need for improved location data verification
Retailer Retention: 364 closures over 4 years (91/year) suggest need for retailer support programs, especially for small businesses
Data Source: Historical SNAP Retailer Locator Data from USDA FNS, extracted via Wayback Machine (archived September 2024). Dataset includes store name, type, address, authorization dates, and coordinates for all Hawaii SNAP-authorized retailers.
SNAP’s role in the retail food economy
SNAP's Economic Impact on Hawaii Food Retailers
Understanding SNAP's role in Hawaii's retail food economy:
Total SNAP Spending in Hawaii
~$60+ million/month in SNAP benefits (2024-2025)
~$720+ million/year flowing to Hawaii food retailers
130,000 households enrolled (2024 data)
Additional $40-45M/year expected from policy changes (2024)
Provides stable, predictable revenue stream for retailers
SNAP Share of Retailer Sales (National Data)
Grocery stores: 20% of sales from SNAP
Convenience stores: 23% of sales from SNAP
Dollar stores: 34% of sales from SNAP
Mass retailers: 25% of sales from SNAP
Some stores in low-income areas: 50%+ SNAP sales
Overall: 8-12% of all U.S. household food purchases
Retailer Vulnerability
Over 80% of SNAP benefits spent at larger stores (supermarkets, superstores)
Small retailers particularly vulnerable in high-poverty areas
Convenience stores (48.6% of new Hawaii authorizations) heavily SNAP-dependent
Rural stores may rely on SNAP for survival in food desert areas
20% SNAP benefit cut could force closure of high-dependency stores
Economic Multiplier Effect
$1 in SNAP = $1.50-$1.80 in local economic activity
GDP multiplier: 1.54x during economic downturns
Every $1 billion in SNAP supports 13,560 jobs
In 2020: SNAP supported 199,000 jobs in independent grocery + 45,000 in related industries
Benefits ripple through agriculture, manufacturing, transportation, services
Hawaii's Unique Considerations
Hawaii's high cost of living means higher benefit levels per recipient
Island geography limits competition; store closures create food deserts
Import-dependent food system amplifies economic multiplier effects
Tourism economy volatility makes SNAP countercyclical support critical
Shutdown could remove $60M+/month from Hawaii's food retail economy
Shutdown Impact on Retailers
If November SNAP benefits are disrupted:
$60+ million loss in monthly revenue for Hawaii food retailers
20-50% revenue drop for SNAP-dependent small stores
Risk of store closures in high-poverty neighborhoods
Job losses in retail, distribution, food service sectors
Permanent damage to rural/underserved food access infrastructure
Counties
Counts follow population; need does not. The Big Island carries double Honolulu's per-capita burden.
Distribution of SNAP participation across Hawaii's four counties (through January 2025).
The same program, a very different burden
—
—
Each figure = 1% of that county’s residents. The Big Island carries more than double O‘ahu’s per-capita SNAP rate — counts follow population, but need does not. Source: USDA FNS county data ÷ 2024 census population.
Participation by County
Public Assistance vs. Non-Public Assistance
Breakdown of SNAP participants by public assistance status in each county.
Understanding Public Assistance (PA) vs. Non-Public Assistance (Non-PA)
SNAP recipients are categorized based on whether they receive other forms of public assistance in addition to SNAP benefits:
Public Assistance (PA) Households
Recipients who also receive other cash welfare benefits such as:
TANF (Temporary Assistance for Needy Families) - cash welfare for families with children
SSI (Supplemental Security Income) - assistance for elderly, blind, or disabled individuals
General Assistance - state/local cash assistance programs
Non-Public Assistance (Non-PA) Households
Recipients who receive only SNAP benefits and no other cash welfare. This group represents 70-80% of all SNAP participants and includes:
Working families - the "working poor" with jobs but insufficient wages
Low-wage workers - especially in Hawaii's service and tourism sectors
Households without children or those not receiving TANF/SSI
Key Insight: SNAP Serves Working Families
The dominance of Non-PA participants reveals that most SNAP recipients are working families, not welfare dependents. Wage insufficiency—not unemployment—is the primary driver of SNAP participation in Hawaii.
Policy Implications
This breakdown shows that addressing food insecurity requires not just assistance programs, but also wage growth, affordable housing, and economic development to help working families afford Hawaii's high cost of living.
Implications
Volume vs. Per-Capita Need
Honolulu (Oahu) dominates participation by raw volume (58.6% of recipients) simply because 69% of residents live there — but its per-capita rate is the lowest at 9.1%. On a per-capita basis the burden is highest on Hawaii County (Big Island) at 19.0% — more than double Honolulu — while Maui (10.2%) and Kauai (10.8%) sit near the 10.8% statewide average. Counts follow population; need does not. (Population: 2024 Hawaii State Census.)
Geographic Challenges
Inter-island differences highlight unique challenges: Hawaii County's large geographic area, Kauai's isolation, and Maui County's multi-island jurisdiction all affect program administration and access.
Economic Diversity
The ratio of Public Assistance to Non-PA participants varies by county, reflecting different economic structures and employment patterns across the islands.
Resource Allocation
County-level data informs targeted outreach, application assistance, and retailer network development to ensure equitable access across all islands.
County Data Updated: County bi-annual data now current through January 2025. Statewide monthly data is current through May 2025. This updated data reveals pandemic recovery patterns across all four islands.
Latest month by county · DHS · May 2026
The most current DHS month, normalized by 2024 population — a year ahead of the bi-annual federal county snapshots above. Sub-island branches (Moloka‘i, Lāna‘i) roll up into Maui County.
The long view
Hawai‘i moved food against crisis long before SNAP — or this 1989 record — began.
Everything above starts in 1989, where the monthly data does. The need, and the response, are far older. Three threads run from the Kingdom to today: food as care, as statecraft, and as surplus turned toward hunger — and each crisis tends to leave the baseline a little higher than before, the same staircase the charts trace.
Kingdom Hawai‘i · statecraft
The royal storehouse
Kings built storehouses — managed by the kalaimoku — to gather food and goods. David Malo framed them plainly as a tool of loyalty, bound to a duty of care: a king who oppressed the maka‘āinana could be put to death by them.
As the rat will not desert the pantry where he thinks food is, so the people will not desert the king while they think there is food in his store-house.David Malo, Hawaiian Antiquities
1790s–1868 · crisis logistics
Moving food between the islands
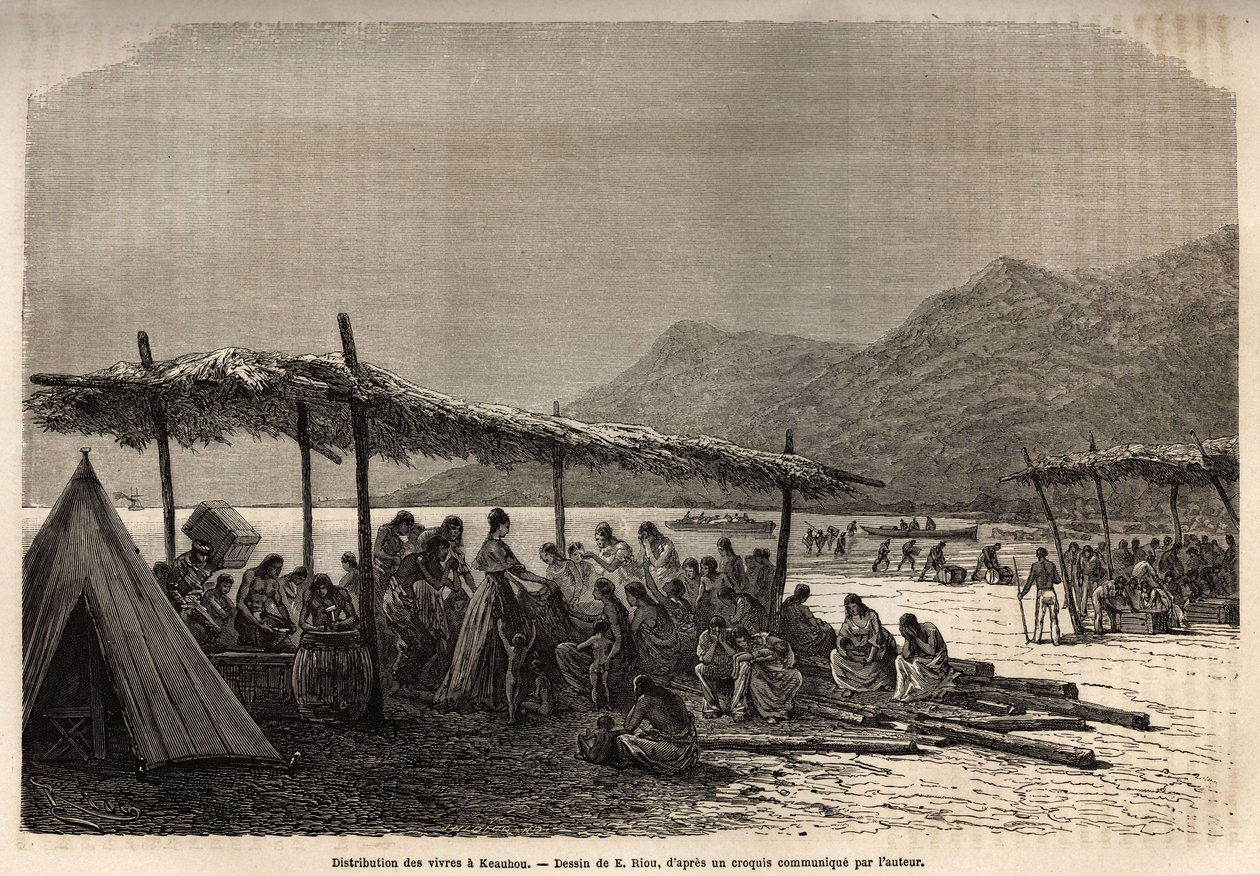
Under Kamehameha I, schooners and brigs carried tribute — poi, pigs, salted fish — between islands as a buffer against local shortage; one vessel was logged simply as the Pakukai, “food supply.” After the Great Ka‘ū Earthquake of 1868 — quake, lava, fire, and tsunami, 81 dead — the cabinet chartered the steamer Kīlauea within a week, carrying King Kamehameha V, his finance minister, and relief food to Hawai‘i Island.
Distribution of relief food at Keauhou, 1868 — engraving after É. Riou, from Charles de Varigny’s account of the voyage. A literal depiction of Kingdom-era disaster relief, the same shape as the modern shocks above: disaster, displacement, the state moving food.
1939–2008 · surplus meets hunger
How the federal program reached the islands
The modern food-stamp idea was born of a paradox: in the Depression, farmers produced surpluses while families went hungry. The answer — route surplus to the poor while paying farmers a fair price — welded food assistance to farm policy for good. A first program ran 1939–1943, was revived as a pilot in 1961, and was made permanent by the 1964 Food Stamp Act, which dropped the surplus-commodity requirement and shifted the goal from disposing of surplus to addressing hunger. The program reached Hawai‘i in the 1970s and was renamed the Supplemental Nutrition Assistance Program — SNAP — in 2008.
to 1840Royal storehouses
1868Ka‘ū earthquake relief
1939First U.S. food stamps
1964Food Stamp Act
1989 →This record begins
2008Renamed SNAP
Sources: David Malo, Hawaiian Antiquities; Peter R. Mills, Connecting the Kingdom (2022); de Varigny / É. Riou, 1868; USDA FNS program history. Fuller sourcing lives in the project’s food-assistance history note. The chart series throughout this page begins in 1989.
Civil society
SNAP is the floor — a community network catches what falls through.
Federal benefits are only part of how Hawai‘i feeds itself. Food banks, pantries, mobile distributions, churches, and mutual aid carry the households SNAP doesn’t reach — or doesn’t reach far enough — and they surge in exactly the moments the line above turns: pandemic, wildfire, shutdown.
Not a new idea
When the 1868 Ka‘ū disaster struck (see Origins), the king’s relief steamer was only half the response. In Honolulu, residents organized collections and lotteries for the victims; at Hilo, Catholic families gave “a calabash of poi here, a pig there, several chickens, a few eggs,” and took refugees into their homes. As the finance minister de Varigny observed, “Hawaiians give away today whatever tomorrow they will ask of others.” Community food-sharing has always run alongside official aid — what follows is its modern form.
1 in 3
Households Food-Insecure
30% in 2023
173,000
Served Monthly by the Network
Q3 FY2025 · pandemic-era levels
29.1M lbs
Food Distributed
FY2025 · ~$105M retail value
500+
Partner Agencies & Pantries
statewide
The need · 2023 Hawai‘i Foodbank study
Food insecurity across the islands
Overall Crisis Level
30% of households experienced food insecurity in 2023
37% of all households anxious about running out of food
11% low food security · 19% very low
10% of households went a whole day without food some or most months
Another 14% were marginally food secure
Child Food Insecurity
29% of households with children faced food insecurity
9% had children skipping meals due to lack of money
6% had children go a whole day without food
38% of adults in households with children were food-insecure
Parents sacrifice their own food security before letting children go without
Geographic Disparities
Hawai‘i Island: 40% food insecurity (highest)
Maui: 31%
O‘ahu: 28%
Kaua‘i: 23% (lowest, but still critical)
Consistently high across all islands (23–40% range)
The response · Hawai‘i’s food-bank network
Where to get food: the three food banks and their pantry partners
Every pantry, produce distribution, and meal site in the three island food-bank networks — 266 mapped locations. Stars mark the food banks themselves. The dots cluster where people are (urban O‘ahu) but also reach deep into rural Hawai‘i Island, Kaua‘i, and Maui County, including Moloka‘i. Toggle the coloring:
Sites pulled from the Hawai‘i Foodbank, Maui Food Bank, and The Food Basket live locators (2026) and geocoded (US Census + OpenStreetMap, a few by hand). One online/multi-school program without a fixed address is omitted.
How the network carries the load
Statewide Capacity (FY2025)
500+ agency partners and pantries statewide
29.1 million pounds of food distributed
1,319 mobile distributions across the state
173,000 individuals served monthly (Q3 FY25) — already at pandemic-era levels
Hawai‘i Foodbank: ~$105M worth of food at retail cost
Island-by-Island Network
O‘ahu: 211 partners, 20.1M lbs, 752 mobile distributions
Kaua‘i: 64 partners, 2.1M lbs, 110 mobile distributions
Maui: 129 partners, 7.6M lbs, 93 mobile distributions
Hawai‘i Island: 100 partners, 2.8M lbs, 364 mobile distributions
Efficiency & Local Support
5.3× purchasing power — $1 donated = $5.30 in food value
$4+ million spent with local farmers and producers (FY2025)
77% of O‘ahu’s produce budget spent with local farmers
Feeding families while supporting local agriculture
Federal Funding at Risk
20% of food distributed comes from USDA commodity programs
TEFAP CCC program ended Spring 2025: $4M loss
That was 7% of all food distributed by Hawai‘i’s food banks in 2024
Further TEFAP/CSFP disruptions possible during a shutdown
Feeding people and farmers at once
The same instinct — keep food dollars close to home — links the food-bank network to the food-hub & Double Bucks programs, where SNAP benefits are matched to stretch further at local markets. Civil society and the federal program reinforce each other: one buys local produce to give away, the other doubles a recipient’s dollar at the farmers’ market. Both move money to Hawai‘i farmers while feeding families.
Find food assistance
If you or your family need food, help is available now — federal and community.
What the data adds up to — and what it still can't tell us.
A caveat before the conclusions: these charts show what happened, not why. Participation and benefits move with forces the dashboard doesn't (yet) model — Farm Bill reauthorizations and SNAP rule changes (eligibility, work requirements, benefit formulas, COLAs), and the broader U.S. and Hawai‘i economy (wages, cost of living, tourism cycles, unemployment). The event markers flag the biggest shocks, but a line turning after a policy change is a correlation, not a measured effect. Read the trends as an outcome record, not a causal model.
Policy & Planning
Early Warning System: SNAP participation trends can signal economic distress 3-6 months before other indicators, valuable for state budget planning
Benefit Adequacy: Hawaii's high cost of living requires ongoing attention to benefit levels; even maximum allotments may not cover true food costs
Work Requirements: The 2025 OBBBA policy changes will likely affect participation rates; baseline data here provides comparison points
Disaster Preparedness: COVID-19 demonstrated the program's capacity for rapid expansion during crisis; lessons apply to natural disasters
Economic Impact
Local Multiplier Effect: Every $1 in SNAP benefits generates approximately $1.50-1.80 in local economic activity, supporting Hawaii retailers and farmers
Tourism Dependency: Sharp pandemic spike reveals vulnerability of service sector workers; diversification efforts warranted
Federal Investment: Peak monthly costs of $111M represent substantial federal support to Hawaii's economy, with ripple effects throughout food supply chain
Benefit Reductions: The 3-year decline in maximum allotments (2024-2026) will reduce purchasing power; monitor food security impacts
Hawaii-Specific Considerations
Island Geography: Inter-island disparities require tailored approaches; one-size-fits-all policies may not serve rural counties effectively
Food Costs: Import dependence drives high food prices; SNAP benefit adequacy must account for 30-50% higher costs than mainland
Retailer Network: 2,641 authorized retailers (2004-2024) with 94.8% valid coordinates; stable network with high turnover (370 new, 364 closed 2020-2024)
Convenience Store Dependence: 48.6% of new retailer authorizations are convenience stores, reflecting dispersed geography but raising healthy food access questions
Food Hubs & Local Agriculture: Food hub SNAP sales grew 8.2x from 2021-2024 ($136K to $1.1M), with Double Bucks incentives adding $479K in 2024. This demonstrates potential to connect SNAP recipients with local farmers while supporting Hawaii's agricultural economy
Cultural Factors: Strong family support networks may reduce participation relative to need; stigma reduction efforts important
Data & Research Needs
Current Data: Updated through May 2025, capturing complete post-pandemic recovery period and recent policy changes
New 2025 Analyses: Post-pandemic recovery trajectory (2019-2025) and retailer network evolution (2020-2024) now available
Missing Dimensions: Demographic breakdowns, household composition, and reasons for participation would enhance understanding
Spending Patterns: SNAP expenditure data by retailer type would reveal food purchasing behavior and healthy food access
Outcome Measures: Link SNAP participation to food security, health, and educational outcomes to demonstrate program impact
County Granularity: More frequent county-level updates would enable targeted interventions and equity monitoring
Future Outlook
Benefit Trajectory: Three consecutive years of decreases (2024-2026) will test program adequacy against rising food costs
Work Requirements: November 2025 OBBBA changes may reduce participation; November data will be critical benchmark
Economic Recovery: Tourism rebound vs. cost of living increases create competing pressures on participation
Climate Impacts: Increasing natural disasters may drive periodic spikes; program flexibility essential
Retailer Network Evolution (2020-2024) - Network stability analysis showing 370 authorizations, 364 closures, convenience store dominance, and local food growth
Visualizations: Analysis charts available in /Data/ directory showing participation trends, benefit changes, retailer patterns, and county distribution
Access the Data
All data, analysis tools, and update procedures are available on GitHub: